The last module in the 5-part course was the Capstone where we had the opportunity to do an optional project. Always game to get the most out of things, I decided to take the bull by the horns and sign up.
For the project, we had to find a data set, 'scrape' it to find some specific information, put that into a database, and finally, visualise the results. There are data sets about many different fascinating subjects such as:
- the last words of inmates in Texas before execution since 1984
- the "Million Base" of 2.2 million chess matches
- a Twitter data set
- World Health Organisation data set
- Family food data set
- Million Song data set
and so on. For my project however, I chose the Transport for London data set available in their Application Programming Interface (API). It provides access to real time data on the most highly requested information across all modes of transport. It also provides data on accidents across London. I wanted to find out about bicycle accidents (just because), and discover where most accidents happen. I thought it would probably be the City of London which is densely populated during the day and has high cycling activity (couriers etc.).
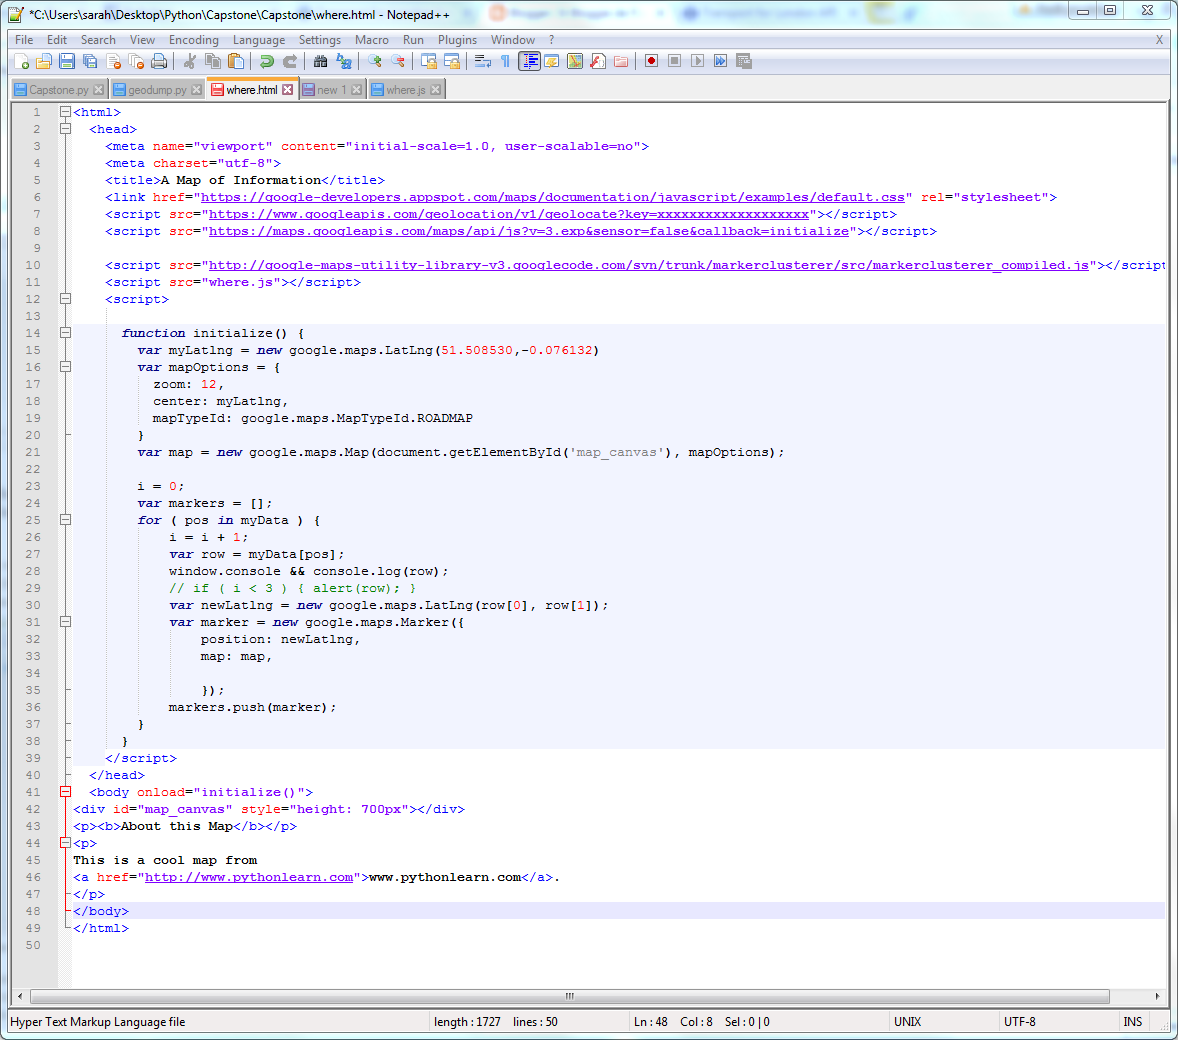
The first thing I had to do, I discovered, was apply for an API key giving me permission to scrape the data. Then I had to write the code, which I based on code we had seen during the course (click on the images to see them bigger and better).

This code creates the database, connects to the TfL API, asks for the year to download and inserts the longitude, latitude, severity and victim (cycle, car, motorcycle, etc.) into the database for that year. Then it saves the data and closes the connection.
It took me a few days because I wasn't sure about exactly what I needed to do - did I need to create a dictionary, or two, or none...? That's half the problem actually, for me - identifying the structure of the code you need to write for the job you want to do.
My code is really simple too. It just asks for one year, not multiple years. It assumes there are no errors in the year entered (e.g. 2016 which is not available yet). I could make it more robust, but to start with, I just wanted to make it work!
This is what the data looks like in the API:
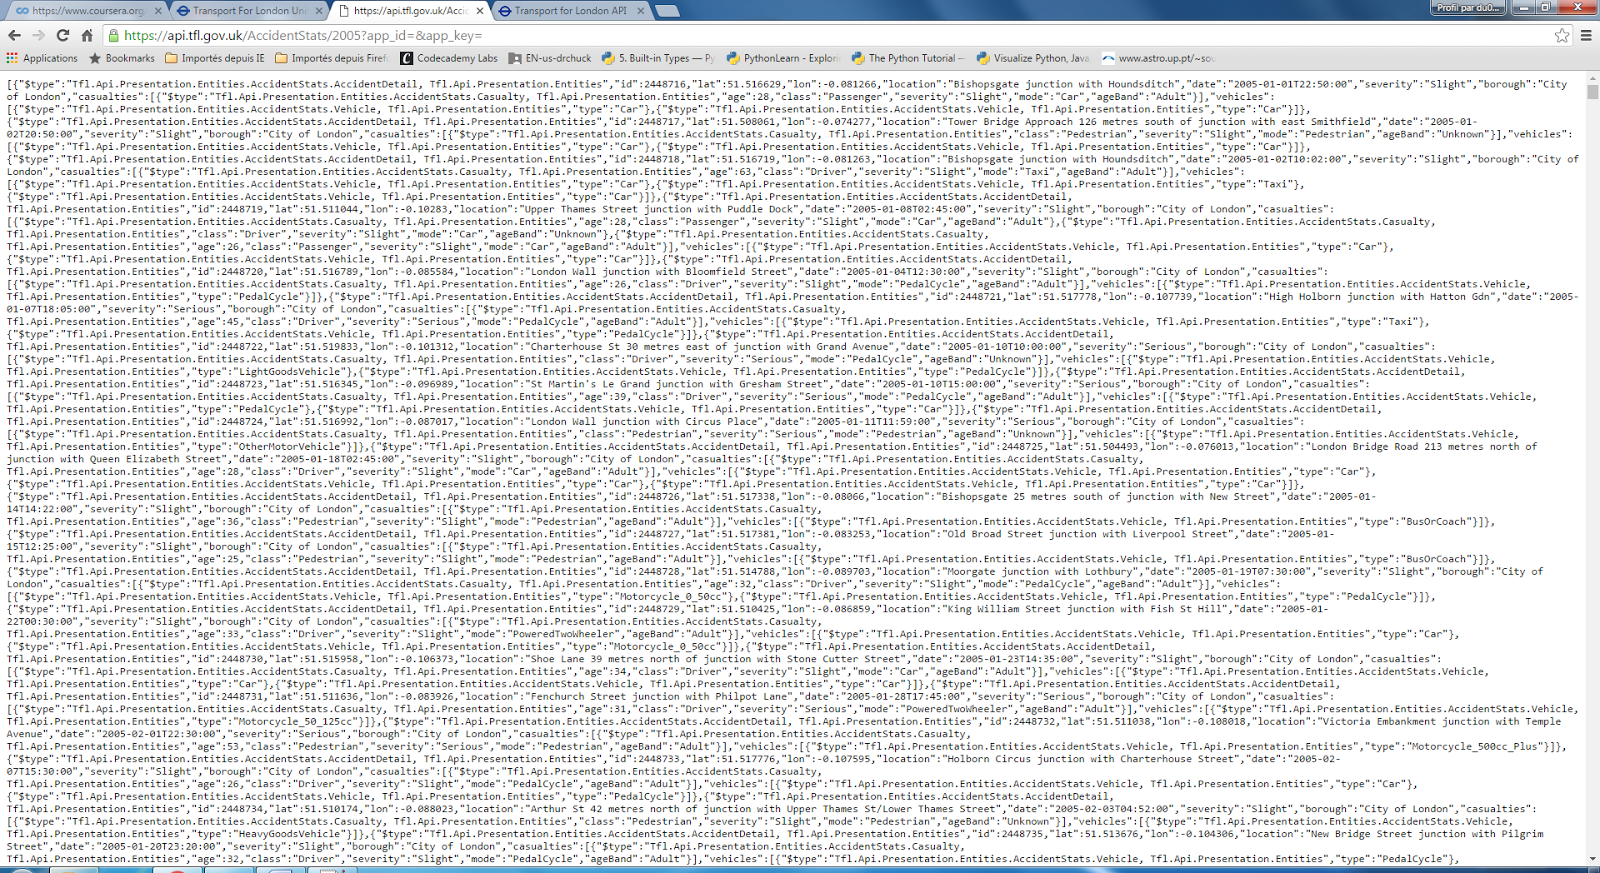 |
| TfL API raw data |
This is what it looks like 'pretty printed':
 |
| TfL API data in readable format |
This is what the database my code created looks like, it has 23116 rows of data:
 |
| Database |
Having got the data, I then had to write some code to select the cyclist accident set, choosing 'severe' accidents rather than fatal ones (too sad), iterating through the data, and writing the longitude and latitude locations only to a javascript file.
 |
| Code to select geolocation data |
 |
| The geolocations of severe cycle accidents in London |
Once I had the geolocation data, I then had to visualise it. I had already used some visualisation code earlier in the MOOC, so just had adapt it to visualise my data. It actually took me three days because I ran into a problem and had no idea what to do. The code was written in html, which I know nothing about. I hunted around for a solution on the internet, including that fabulous resource Stackoverflow, but couldn't find an answer.
I was stumped. Then I moaned to my DB about my problem, and he said that I should check the latitude and longitude coordinates because they might not be in the right format. And he was right! They were back-to-front in my code! Once I'd fixed that, up popped the little red labels as they should (with another nerdy moment).
 |
| Great London severe accident sites |
 |
| Central London severe accident sites |
It's been a really satisfying few months, going from being a complete Python beginner/never having touched coding before, ever, and having been crap at maths, to producing an amazing, functioning final result that I had to understand to make work (more-or-less, let's just ignore the html...). Dr Chuck was an entertaining teacher who could engage with us across a screen (no mean feat), and who even set up live 'office hours' during the Capstone so we could interact with him directly. He was aided and abetted by a team of kindly mentors who were available to help us out and give advice in the forums.
I am very happy with the results, and aim to go on and tackle C# next!
Well I have absolutely no idea what a lot of this means but the end result is impressive!
ReplyDeleteI've been writing about Capstone today too - making notes about Capstone Hill in Ilfracombe!!
Thanks Trish, it looks impressive to me too. :)
DeleteI hope you walked to the top of Capstone Hill, and in a Buff or two... :)
Well Sarah, that is one hell of an achievement. Python is a great language. I hope that you had a bottle of something really nice to celebrate?
ReplyDeleteThanks Nick, I had a glass of robust red organic wine. Very nice it was too. :)
DeleteI stopped reading at about '' I've done it ! ''
ReplyDeleteWell done if that is appropriate.
It is, Potty, thanks. :)
DeleteAs a programmer by trade I am really impressed you learned so much so quickly. Congratulations.
ReplyDeleteThank you for your kind words, Tim. :)
DeleteWow this looks so complicated but congratulations on learning it all. Have a good week Diane
ReplyDeleteHi Diane, thanks! It took a lot of gnashing of teeth. :)
DeleteThis makes much more sense since seeing the video. Still bleedin' awesome.
ReplyDeleteThanks Anya. :)
Delete